The Greater Chattanooga housing market continued to show active movement in August 2026, with increases in available inventory, pending sales, closed transactions, and the median sales price. At the same time, homes are spending more time on the market, giving both homeowners and prospective purchasers important information to consider as they make their next move.
Here is a closer look at the latest Greater Chattanooga real estate market data.
Inventory Continues to Grow
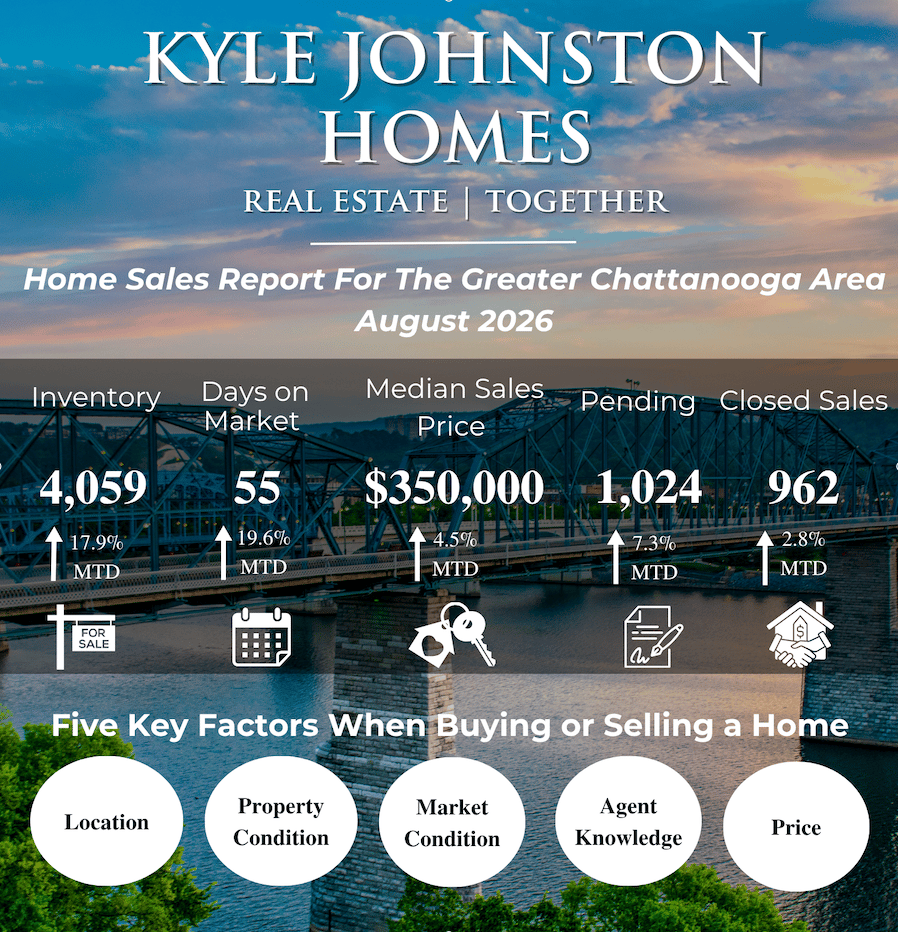
Inventory reached 4,059 homes, representing a 17.9% increase. The rise in available homes gives people searching in the Chattanooga area a broader selection of properties to consider and creates more opportunities to compare location, condition, amenities, and price. For homeowners preparing to list, increased inventory also means presentation and positioning matter. Pricing a property appropriately and preparing it well for the market can become increasingly important as potential purchasers have more choices.
Homes Are Taking Longer to Sell
The average time on market reached 55 days, an increase of 19.6%. A longer marketing period does not necessarily mean demand has disappeared. Instead, it can indicate that people are taking more time to evaluate their options as inventory expands. For homeowners, this makes having a well-planned pricing and marketing strategy especially important from the beginning.
Median Sales Price Reaches $350,000
The median sales price increased to $350,000, up 4.5%. Despite higher inventory and longer marketing times, home values continued to show year-over-year strength across the Greater Chattanooga area. Of course, market value can vary significantly depending on the neighborhood, property condition, improvements, lot, and surrounding comparable sales. For that reason, broad market statistics are a helpful starting point, but understanding the value of a specific property requires a closer look at its immediate market.
Pending and Closed Sales Remain Active
August recorded 1,024 pending sales, an increase of 7.3%, while 962 homes closed, representing a 2.8% increase. Those figures indicate continued transaction activity throughout the Greater Chattanooga market. Even as people have more homes to choose from and properties take longer to sell, homes are continuing to go under contract and successfully close.
What Does the August Market Mean for Chattanooga Real Estate?
The August numbers show a market with more options, continued pricing strength, and ongoing sales activity. For someone considering purchasing a home, additional inventory can provide more opportunities to compare properties and make a thoughtful decision. Understanding the condition of a home, recent comparable sales, and the dynamics of the specific neighborhood can help determine how to approach an offer. For homeowners considering selling, increased competition makes preparation especially important. Location, property condition, current market conditions, agent knowledge, and price all play a role in how a home performs once it reaches the market.
Real Estate Is Local
Greater Chattanooga statistics provide an important overview, but the market can look very different from one community to another. Conditions in Hixson, Soddy Daisy, Ooltewah, East Brainerd, North Chattanooga, Downtown Chattanooga, and surrounding North Georgia communities can vary based on inventory, price range, property type, and current demand. At Kyle Johnston Homes, we believe good real estate decisions start with understanding the numbers, the individual property, and most importantly, what you are trying to accomplish. If you are considering a move in the Greater Chattanooga area, we would be glad to help you understand how the current market applies specifically to your home, neighborhood, or search.